Interpolate during time sampling #116
Description
I was recently reminded of this issue that we had discussed a while back but not written about afaik.
Context
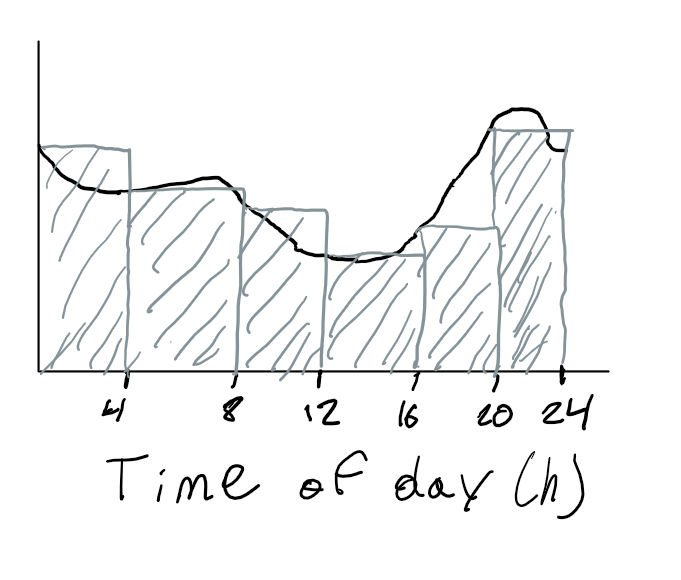
We often model with relatively large time steps (e.g. every 4 hours). Our model computes the energy balance at time points not for time intervals (e.g. energy balance must be true at midnight, 4am, 8am, noon, 4pm, 8pm). Our current method of sampling the data (such as the load) for these time points is to simply use the data at the given time. The assumption is that the time point will represent the entire interval.
Problem
Take a load curve for example (this can apply to other data inputs such as capacity factors). When we sample the load curve we get the grey bars. In some spots these grey bars significantly underestimate or overestimate the load.
Solution
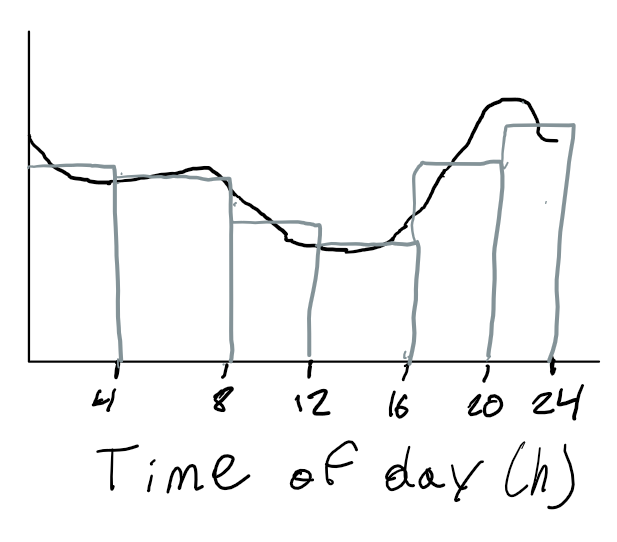
It would be great if instead of sampling at the timepoint, we take the average of all the timepoints within the time interval as our value. This gives a much better approximation as shown below.
Notes
It's important to make the distinction between accurately capturing peaks (max power) and accurately capturing the total energy required. This issue deals with getting a better approximation of the energy required during each time point but not with capturing the peaks. Regardless of the sampling strategy it's likely we miss the point of peak load which may be important to ensure the enough generation is built to satisfy that load. However, as we transition to a storage-dominant grid, I'm guessing what matters most is do we have enough energy capacity in storage more so than do we have enough power capacity to meet the load at the peak.