This repository was archived by the owner on Nov 15, 2023. It is now read-only.
This repository was archived by the owner on Nov 15, 2023. It is now read-only.
Logging takes quite some CPU time #7800
Description
Running polkadot under a profiler I've noticed that a big chunk of time is spent in logging. I lost the original trace, but here is the new one.
The steps I took to obtain the trace
- Launch
polkadot --wasm-execution Compiled(the binary is compiled with --release flag) - Attach
Instrumentsto just launched process - Let it run for a number of seconds (for the attached trace, it's 30 seconds of wall time)
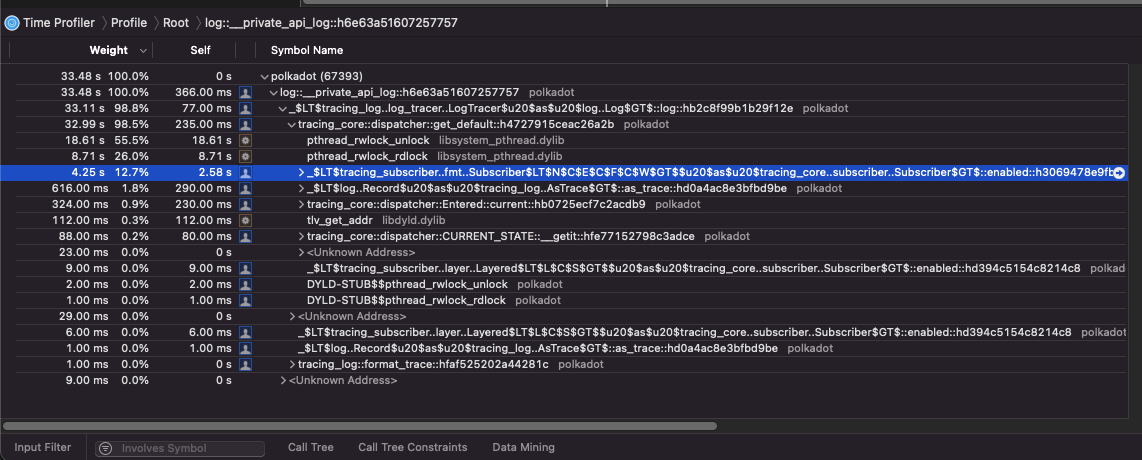
Looking at the trace, focusing on the calls made by log::__private_api_log one can see, that polkadot spent 33.48s of CPU time out of 1.09m in logging.
Most of that time is spent in waiting for the rw lock it seems
macOS Big Sur 11.1
Polkadot: paritytech/polkadot@2495a6b0e
Instruments: Version 12.2 (12C33)