Adding track marks to chromosomes #36
Description
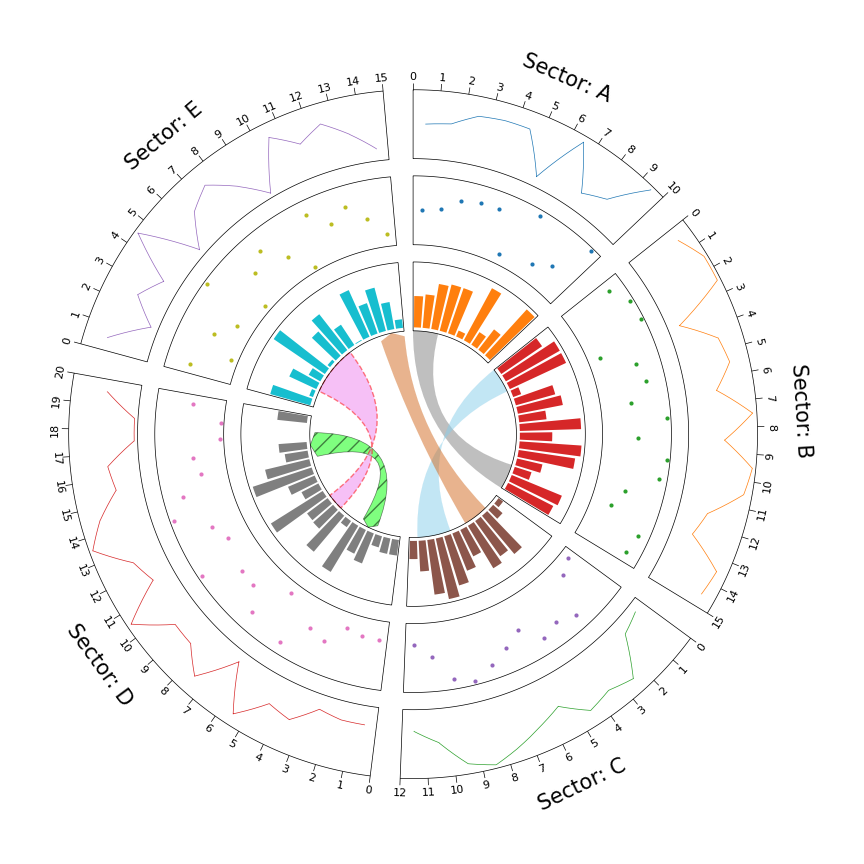
I would like to add tracks marking the chromosome coordinates on each chromosome rectangle. It should look somehow like here, but preferably with more ticks and less numbers.
This is my graph so far:
I used the following code to generate the chromosomes:
%%capture
# Chromosome length (chromosome)
with open(chromosome_file) as f:
    f.readline()  # Skips the header line
    for line in f:
        line = line.rstrip().split(",")  # Split the line into name, start, and end
        name = line[0][3:]  # Remove 'chr' from the chromosome name
        length = int(line[-1])  # The last value is the chromosome length
        arc = Garc(
            arc_id=name,
            size=length,
            interspace=4,
            raxis_range=axis_ranges[1],
            labelposition=60, label_visible=True, labelsize=12,
            facecolor="#d3d3d3" #light gray
        )
        circle.add_garc(arc)  # Add the arc to the circle plot
circle.set_garcs()
Any help will be highly appreciated!