
var lineChart = LineChart()
lineChart.addLine([3, 4, 9, 11, 13, 15])- Super simple
- Highly customizable
- Auto scaling
- Touch enabled
- Two-colored area between line charts
gridVisibleShow or hide grid. Defaulttrue.axesVisibleShow or hide x and y axes. Defaulttrue.dotsVisibleShow tiny dots at data points. Defaulttrue.labelsXVisibleShow labels on x axis. Defaultfalse.labelsYVisibleShow labels on y axis. Defaultfalse.numberOfGridLinesXNumber of grid lines in horizontal direction. Default10.numberOfGridLinesYNumber of grid lines in vertical direction. Default10.animationEnabledDraw line and dots with animation. Defaulttrue.animationDurationAnimation duration. Default1.dotsBackgroundColorTiny dots background color. Default white.gridColorGrid color. Default light grey.axesColorAxes color. Default grey.positiveAreaColorFilled area color when line A > line B. Default light green.negativeAreaColorFilled area color when line A < line B. Default light red.areaBetweenLinesDraw filled area between lines with those two indexes. Default[-1, -1]lineWidthLine width. Default2.dotsSizeDot size. Default12.dotsBorderWidthDot border width. Default4.axisInsetPadding between view border and chart axes. Default10.
Add line to chart.
lineChart.addLine(data: Array<CGFloat>)
didSelectDataPoint()
Touch event happened at or close to data point.
func didSelectDataPoint(x: CGFloat, yValues: Array<CGFloat>) {
  println("\(x) and \(yValues)")
}
var lineChart = LineChart()
lineChart.addLine([3, 4, 9, 11, 13, 15])
var lineChart = LineChart()
lineChart.gridVisible = false
lineChart.dotsVisible = false
lineChart.addLine([3, 4, 9, 11, 13, 15])
lineChart.addLine([5, 4, 3, 6, 6, 7])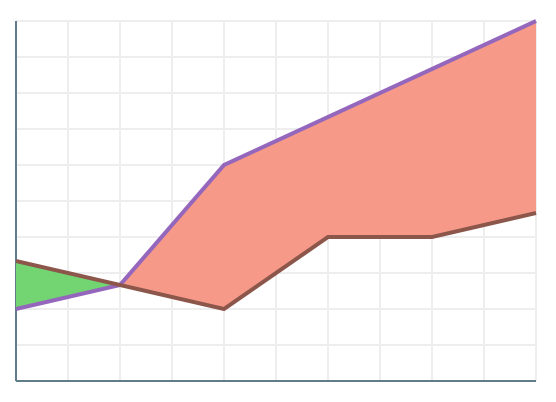
var lineChart = LineChart()
lineChart.dotsVisible = false
lineChart.addLine([3, 4, 9, 11, 13, 15])
lineChart.addLine([5, 4, 3, 6, 6, 7])
lineChart.areaBetweenLines = [0, 1]
var lineChart = LineChart()
lineChart.addLine([3, 4, 9, 11, 13, 15])
lineChart.addLine([5, 4, 3, 6, 6, 7])
lineChart.axisInset = 20
lineChart.labelsXVisible = true
lineChart.numberOfGridLinesX = 5
lineChart.labelsYVisible = true
lineChart.numberOfGridLinesY = 5MIT