A minimum viable product (MVP) to serve as a proof of concept for the intended WFR 2023 data acquisition system (DAQ)
This project has been tested to work with a MCP 2515 based CAN Bus board, which connects to SPI0 on the Raspberry Pi. I used a Raspberry Pi 3B V1.2, but it should work on any 3 and above type RPi models, (although for better compatability with InfluxDB, a RPi 4 series is recommended but more on that later)
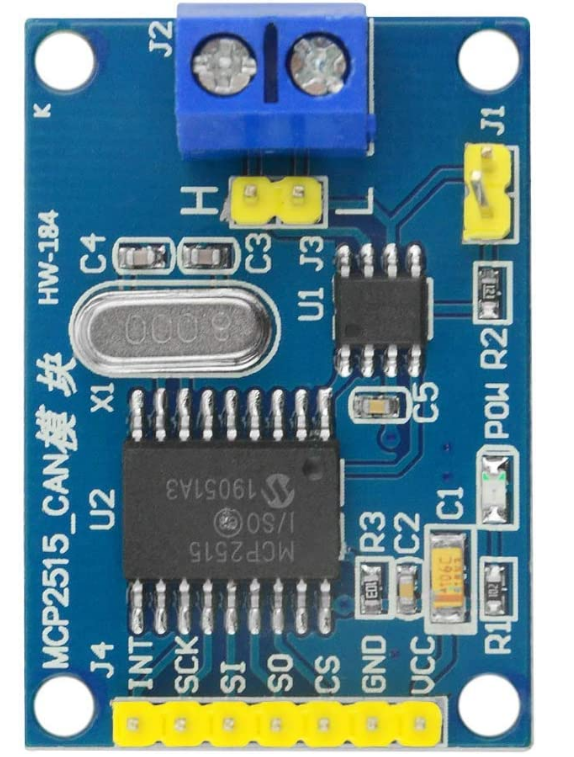
The pin connection is as follows:
| MCP2515 Module | Raspberry Pi Pin # | Pin Description |
|---|---|---|
| VCC | pin 2 | 5V (it's better to use external 5V power) |
| GND | pin 6 | GND |
| SI | pin 19 | GPIO 10 (SPI0_MOSI) |
| SO | pin 21 | GPIO 9 (SPI0_MISO) |
| SCK | pin 23 | GPIO 11 (SPI0_SCLK) |
| INT | pin 22 | GPIO 25 |
| CS | pin 24 | GPIO 8 (SPI0_CE0_N) |
This project heavily relies on SocketCAN which from my understanding is the Linux kernels default CAN Bus interface implementation, that aims to treat CAN Bus interface devices similar to regular network devices and mimic the TCP/IP protocol to make it easier to use. It also natively supports MCP2515 based controllers. Since this is built in, nothing needs to be installed, however the /boot/config.text needs to have the following line appended to it:
dtoverlay=mcp2515-can0,oscillator=8000000,interrupt=25
This gets the Linux kernel to automatically discover the CAN Controller on the SPI interface. If your interface pin has a different oscilator frequency, you can change that here.
Now reboot the Pi and check the kernel messsages (you can bring this up in the terminal by using the command: dmesg | grep spi) or dmesg to view all kernal messages), and you should see the following:
[ 8.050044] mcp251x spi0.0 can0: MCP2515 successfully initialized.
Finally, to enable the CAN Interface run the following in the terminal:
sudo /sbin/ip link set can0 up type can bitrate 500000
If you are using a different bitrate on your CAN Bus, you can change the value. You will need to run this command after every reboot, however you can set it to run automatically on startup by appending the following to the /etc/network/interfaces file:
auto can0
iface can0 inet manual
    pre-up /sbin/ip link set can0 type can bitrate 500000 triple-sampling on restart-ms 100
    up /sbin/ifconfig can0 up
    down /sbin/ifconfig can0 down
if you are using a dual CAN hat:
auto can0
iface can0 inet manual
    pre-up /sbin/ip link set can0 type can bitrate 500000 triple-sampling on restart-ms 100
    up /sbin/ifconfig can0 up
    down /sbin/ifconfig can0 down

auto can1
iface can1 inet manual
    pre-up /sbin/ip link set can1 type can bitrate 500000 triple-sampling on restart-ms 100
    up /sbin/ifconfig can1 up
    down /sbin/ifconfig can1 down
And that's everything to get the CAN Bus interface working! Since SocketCAN acts like a regular network device, we can get some statistic information by using the ifconfig terminal command.
CAN-utils is a set of super useful CAN debugging tools for the SocketCAN inteface. You can install it using the following command:
sudo apt-get install can-utils
This allows us to dump CAN Bus traffic to logs, send test messages and simulate random traffic. Please see the readme on their github page for more details.
If you don't have the required hardware, fret not. You there is a way to set up a virutal CAN interface using SocketCAN and send traffic on it using CAN-utils. However i haven't done this so you will need to do some research on how to do that before moving onto the next step.
The Python script for this project uses pipenv to manage the required python packages, so you will need that installed. Run the following command in your root directory in the terminal:
pip install pipenv
once you have pipenv, you can now clone this project. In the terminal, navigate to the /pythonAPI folder. We can now use pipenv to install all the project requirements in the pip file:
pipenv install
Before we can run this program, we will need to install and setup InfluxDB on the RPi. Looking at the offical documeation, 3 Series RPi's and RPi's running 32bit operating systems aren't supported.....however this seemed to work just fine following this tutorial. The summary of the steps is as follows:
First we need to update our package list and upgrade all our out of date packages. We can do this using the following terminal commands:
 sudo apt update
 sudo apt upgrade -y
Then we can add the InfluxDB repositories to our package manager (apt):
wget -qO- https://repos.influxdata.com/influxdb.key | sudo apt-key add -
source /etc/os-release
echo "deb https://repos.influxdata.com/debian $(lsb_release -cs) stable" | sudo tee /etc/apt/sources.list.d/influxdb.list
Run update again to get the latest version information then install InfluxDB:
sudo apt update && sudo apt install -y influxdb
Running the following starts the InfluxDB service and adds it to the list of programs to run on boot:
sudo systemctl unmask influxdb.service
sudo systemctl start influxdb
sudo systemctl enable influxdb.service
Once this is done, we can now use the InfluxDB client using the influx command. Now we can create a database as well as a user to access that database in grafana by running each of the following lines one by one in the influx client:
create database home
use home

create user grafana with password 'Admin' with all privileges
grant all privileges on home to grafana
We can check it worked by running show users in the client. That's it for influx. you can choose a different password and username, just make sure to update the canInterface.py file if you choose to do so.
While having the data stored in InfluxDB is great for persistant time series data, it doesn't give truly "live" data feeds. Grafana uses data base query's to grab the information to display. In order to achieve reasonable performance, the number of queries is limited to once per second. While this is perfectly fine for reviewing data, it would be nice to be able to watch the data in "real time". MQTT is a messaging protocol based on Websockets that allows for real time telemetry, so I've made it so that all sensor data is published to a Mosquitto MQTT client as well on the RPi so that Grafana can stream it in real time. Disclaimer: This barely works currently, it will show up for a few seconds then disapear, I'm not sure why but it's still in the script so the installation needs to be complete for things to work properly.
CD to the home directory in the terminal and run:
sudo apt update && sudo apt upgrade
Then we can install the Mosquitto broker and client using:
sudo apt install -y mosquitto mosquitto-clients
Then we can make sure it runs on boot by running:
sudo systemctl enable mosquitto.service
To check that it's running we can run:
mosquitto -v
you will get some errors about the address already being in use, that's all good.
Add the packages to apt:
wget -q -O - https://packages.grafana.com/gpg.key | sudo apt-key add -
echo "deb https://packages.grafana.com/oss/deb stable main" | sudo tee /etc/apt/sources.list.d/grafana.list
Update package list and install
sudo apt update && sudo apt install -y grafana
Enable the service and set to start on boot:
sudo systemctl unmask grafana-server.service
sudo systemctl start grafana-server
sudo systemctl enable grafana-server.service
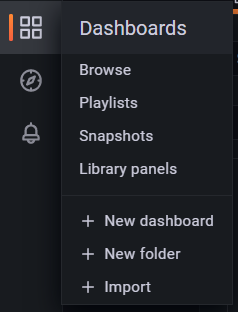
Now Grafana is installed and you can open it in the web browser by going to http://localhost:3000/ (assuming nothing else is on port 3000). The default login is admin for both the username and password. You can then click on the settings button, find "Data sources" and click "add new data source" to add the InfluxDB and MQTT sources.
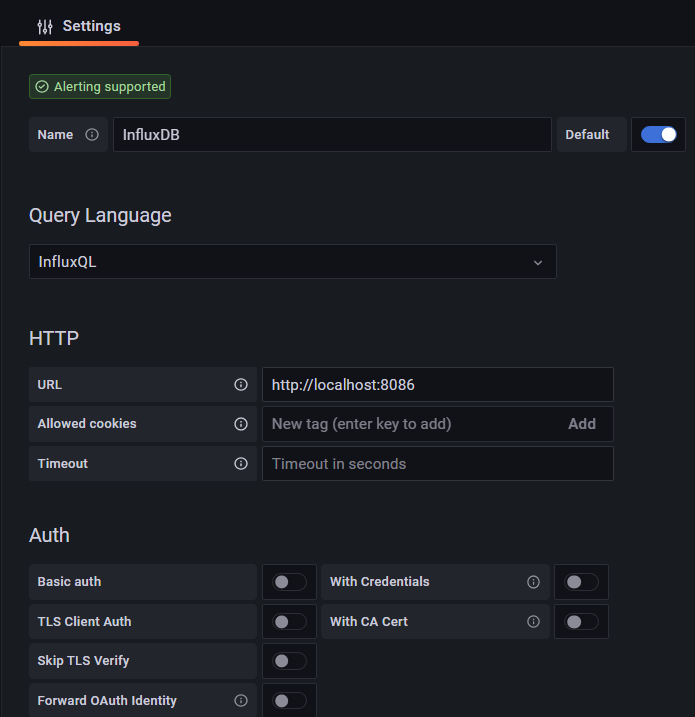
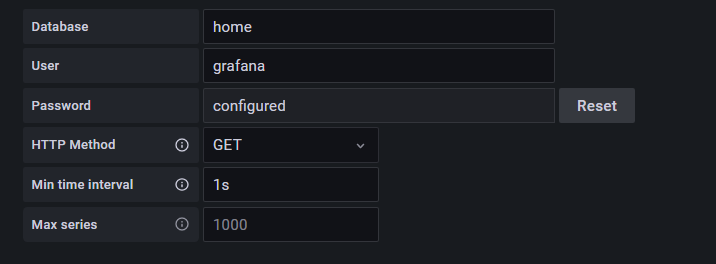
For Influx, the support is already built in so you should be able to just search for it, and enter the following:
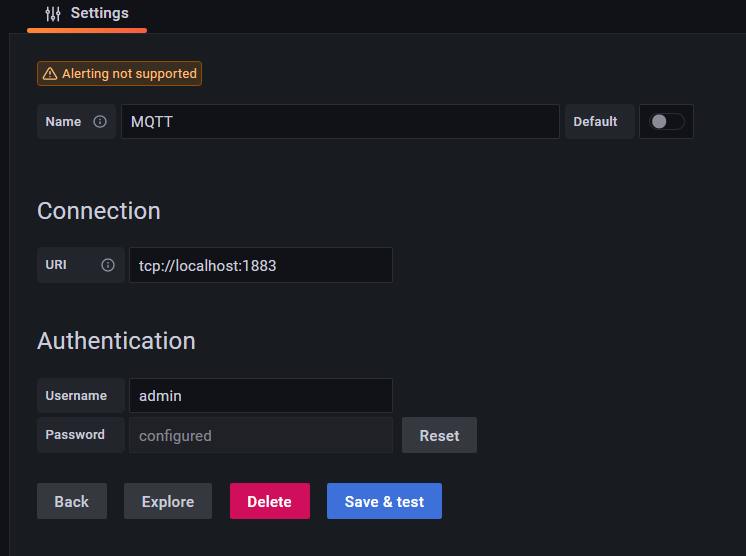
For MQTT you will need to add the MQTT Plugin, back on the settings button, you can click plugins and search for it in the list and install it. Once you do that, you should be able to add it as a data source as follows:
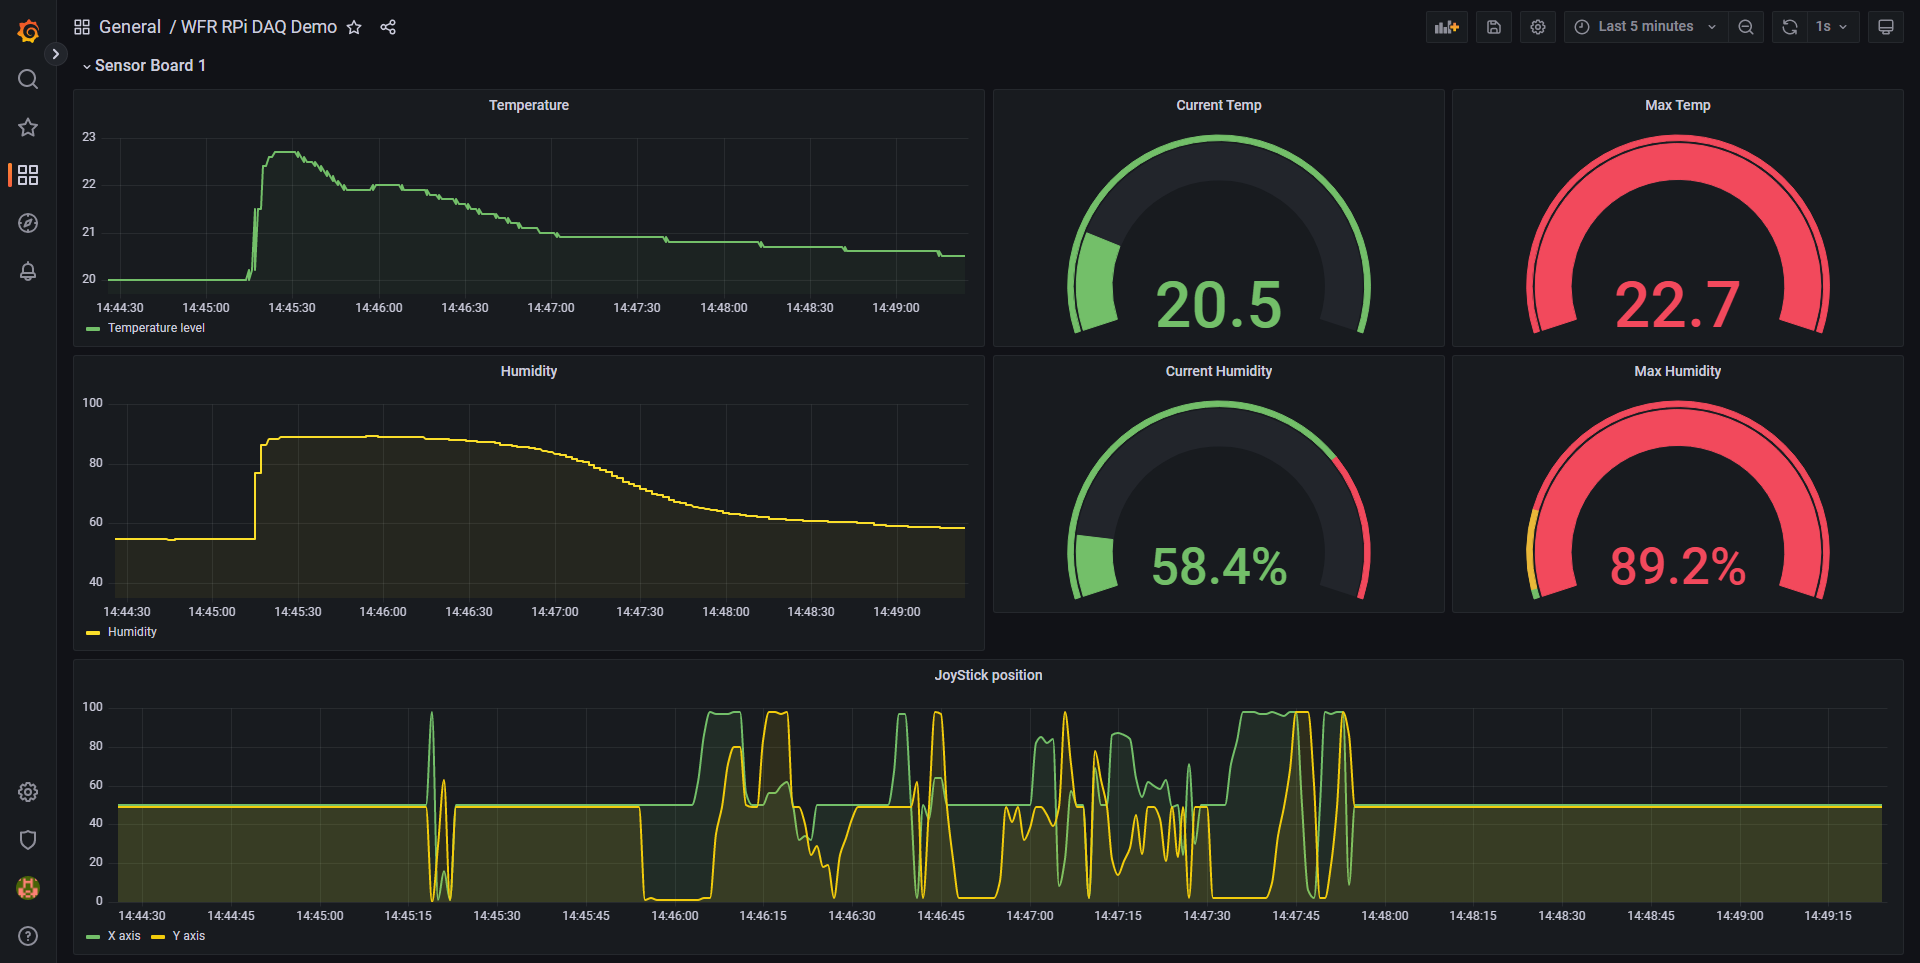
Now if you want to mess around with Grafana yourself, feel free to read the documentation and try setting up your own dashboard, but to use the one I created for this demo, you can import the json from the grafana_template folder in this repository.
And that's it! Everything is setup to allow you to run the script and play with the data output in Grafana
Was this documentation over the top? yes. The goal of this project was to serve as the starting point for a more fully fleshed DAQ system, so I wanted all the setup instructions setup in 1 place to make it easier to fork and work on new versions without spending hours just trying to figure out what needs to be installed.