viteng is a toolkit of matlab functions to easily analyze voltage and current data for triboelectric nanogenerators
First, import your data
[Vt, It] = import_data(1, 5, 3)
This function assumes that all your files are in the form 2a-It or 2a-Vt, for a file with current and another for voltage, respectively. The number represents different samples and the letter represents a trial. You can easily import a range of data groups by using the first two arguments, but if you want to import more than three trials, you should edit the code so that more letters than the first three are represented. To avoid a ridiculous amount of arguments, it is also assumed that these matlab files are in the folder with all your data and that your data is of the format ".data"
From here, it is relatively simple to run all the current peaks in a few seconds.
[peak_values, avg, sd] = get_It_peaks(It, 7, -1)
Since Matlab's peak generator has a low threshold for what a "peak" is, this function sorts all the peak values based on value, skips the largest, and picks the next 7 (or whatever number you chose). To avoid bias, data without an excessive number of peaks should be used.
Voltage is slightly more difficult. Good voltage signals look like this
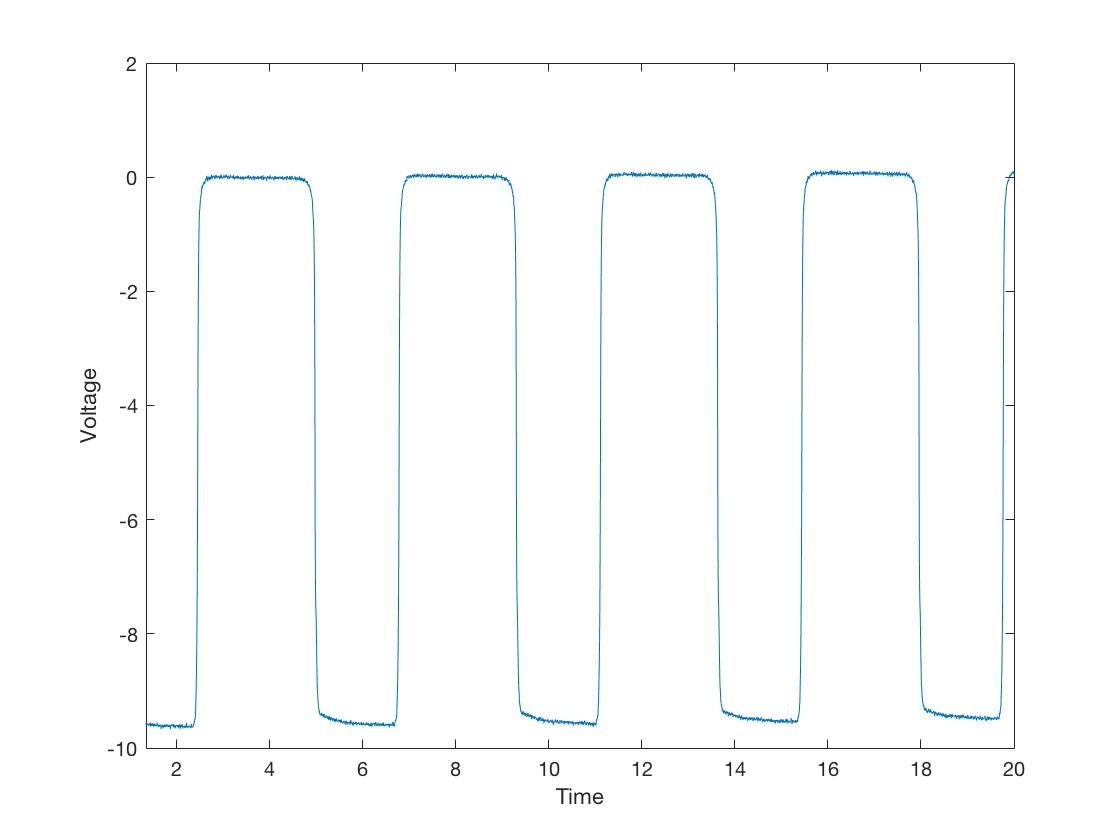
but a slightly worse one looks like
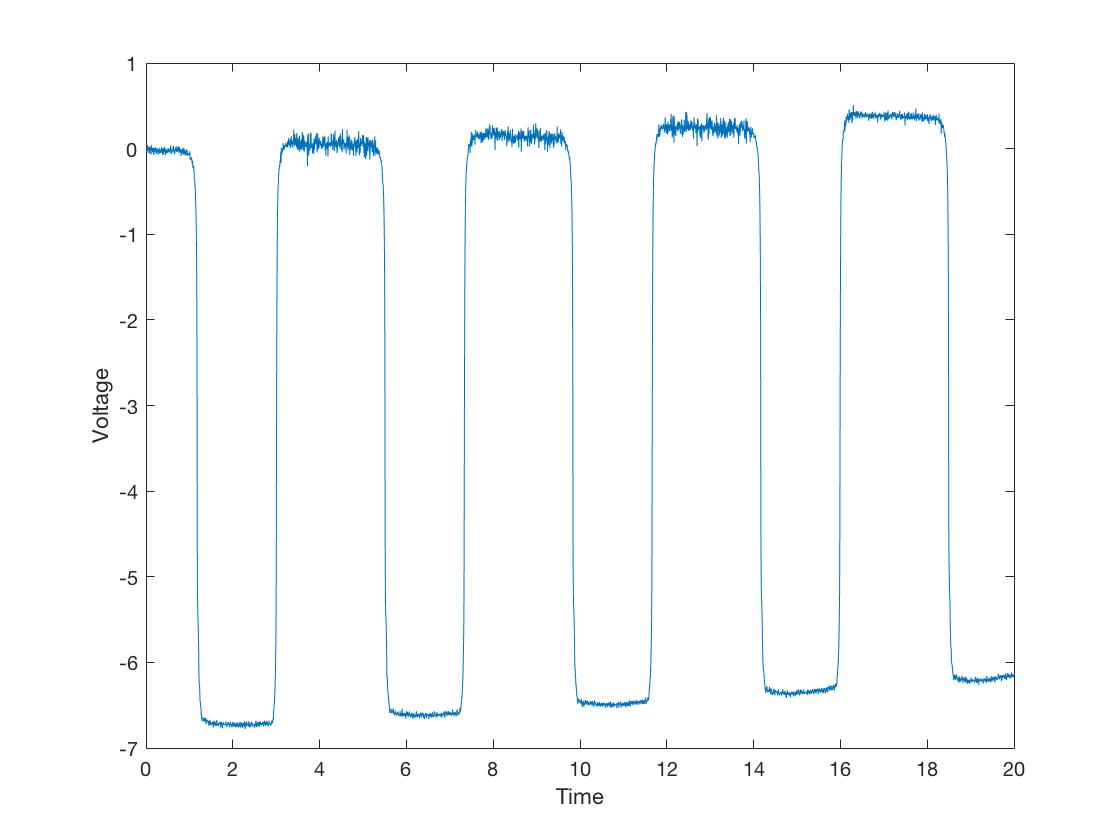
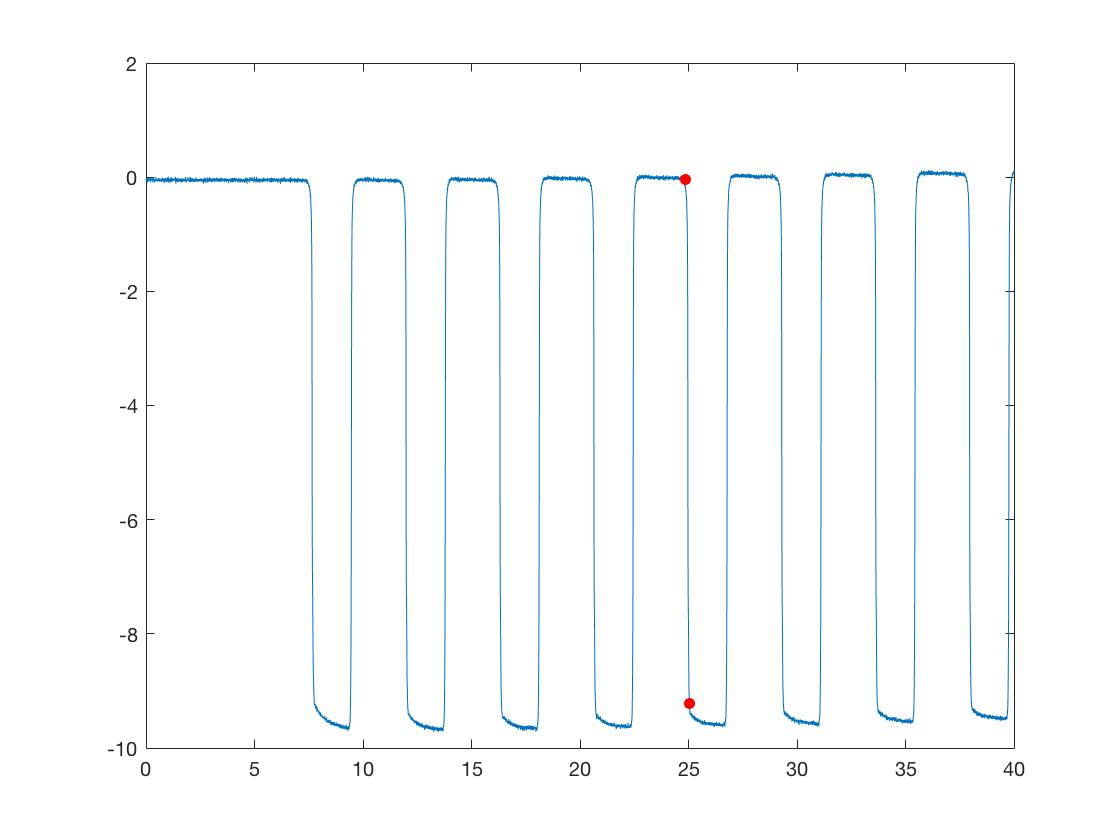
It is thus difficult for programs to distinguish where exactly the signal starts. In these cases, it is best for a human to go in and find the heights however labor intensive it may be. This function streamlines the process by recording the coordinates of the clicks so that there is no need to manually record the values on a secondary program.
[peak_values, avg, sd] = get_Vt_peaks(Vt, 7, 1, 1, -1)
This program also provides some helpful secondary functions. First, all the clicks are marked with red dots to keep track of the clicks, but also there is the option to "backspace" by using the spacebar. It is necessary however, to click in the same order when clicking horizontally. Thus if you like to click all the topmost points first going from left to right, you also must go from left to right for the bottommost points. Clicking all the top ones first or all the bottom ones first can be switched while analyzing by using the codes in the function, as can clicking vertically vs. clicking horizontally.
Also includes two functions to help with making figures. The following function changes HEX color codes to MATLAB RGB (which is regular RGB divided by 255 for each color).
function matlab_color = RGBtoMHex(hex_color)
The following function makes bar plots, using the data that is passed and the colors specified. Vt and It are on the same plot with two y axis.
function VtIt = make_figures(Vt, It, Vt_sd, It_sd, It_factor, sample_names, color_Vt, color_It, degrees)
MATLAB 9.4
- Finding peaks in data: https://www.mathworks.com/help/signal/ug/find-peaks-in-data.html
- Recording mouse clicks: https://www.mathworks.com/help/matlab/ref/ginput.html