This is the repository for the capstone project, Seattle Gentrification Atlas, completed in March of 2018 as part of the Masters of Science in Data Science program at the University of Washington. The Project Team Members include: Deepa Agrawal, Erin Orbits, and Angel Wang.
The Seattle Gentrification Atlas ("Atlas") is an interactive dashboard that combines demographic information with GIS shapefiles to depict gentrification trends in Seattle since 2000. Please checkout the latest prototype design of the Atlas on the Tableau Public site. The interactive proof of concept model hosted on the Tableau Public server allows users to explore:
- patterns of gentrification across Seattle,
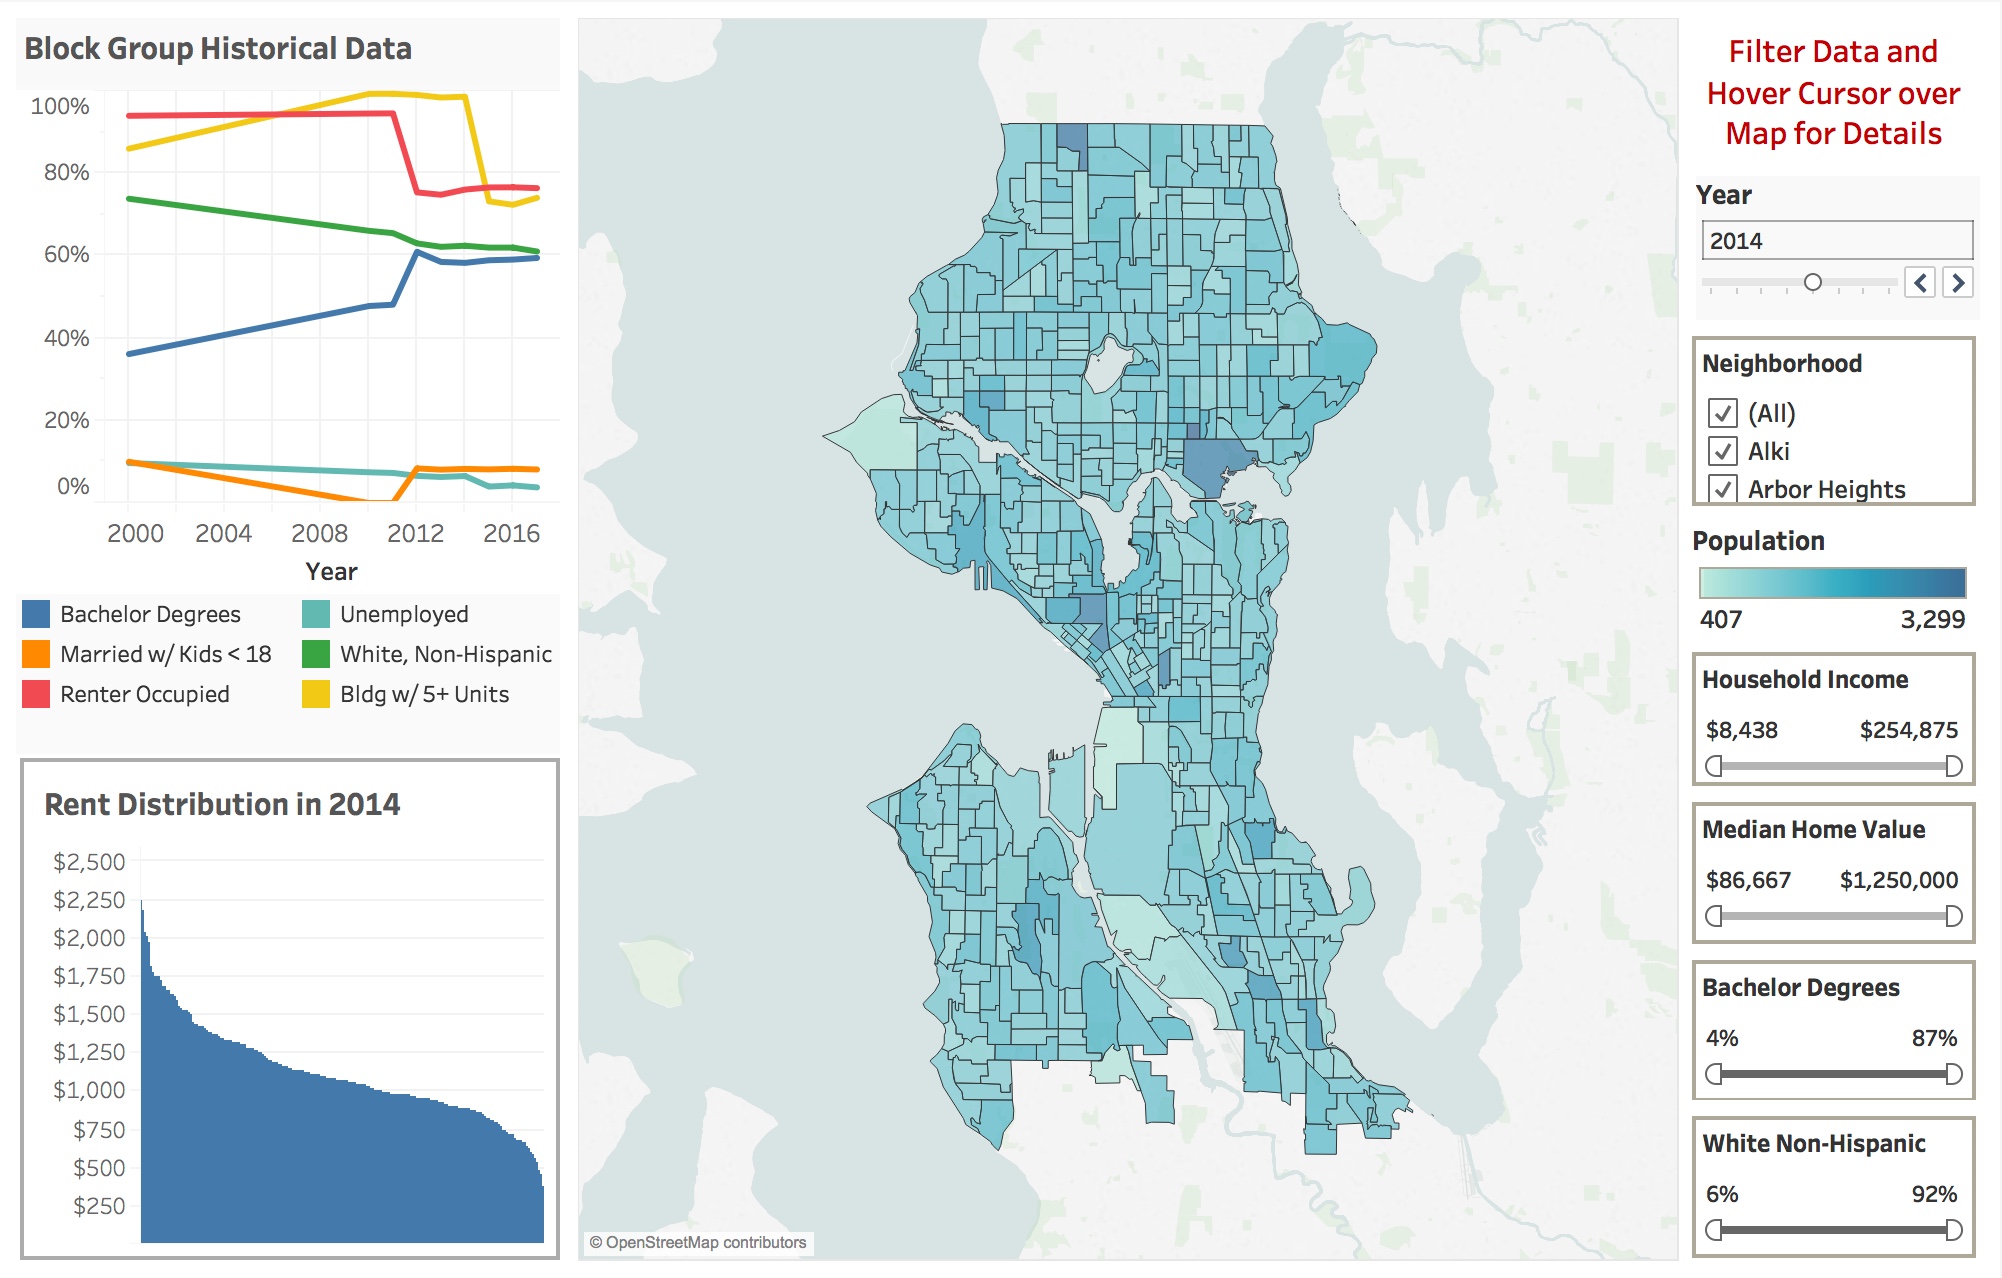
- other demographic factors related to gentrification, and
- how Seattle neighborhoods are likely to change in 2018.
Click the link to download a pdf version of the project poster: download pdf
- Code contains relevant Jupyter Notebook files with code written for this project, see the readme file in the Code directory for more information.
- Data contains shapefiles and the CSV files with data used in this project and the gentrification status labels we generated.
- e.g.
blockgroup_data.csvincludes the demographic data for 2000, and 2010-2017, andSimplyAnalytics_data_with_labels.csvcontains the same data, but with the gentrification status labels.
- e.g.
- Images contains selected screenshots from the Tableau dashboard and other relevant images.
- Project-Proposal contains the final project proposal along with the drafts of the proposal.
- Lit-Review-Docs contains a curated set of documents from the literature review for this project.
Please Note These documents are included for academic research purposes only. Although this repository is public, and we recognize some of this material is copyrighted, we have no intention of republishing this material. The selected documents in theLit-Review-Docsdirectory are included to provide context for our project. This repository is designed solely to facilitate the educational process.
In the years since Microsoft became a household name, the Seattle area continues to benefit from further investment in the technology sector. Consequently, Seattle's real estate market is routinely one of the hottest markets, pushing rent and house prices substantially higher than other metro areas. So, while the rise of the technology sector provides economic opportunities for many residents, it also exacerbates urban inequity through the process of gentrification.
A gentrifying neighborhood is often defined as one that moves from the bottom half to the top half in the distribution of median household income, rent, or home prices. However, gentrification is an umbrella term for describing a process characterized by
(1) the displacement of poor communities by rich outsiders,
(2) the substantial increase in the cost of living, and
(3) the changes to the longstanding character or culture of a community.
Further complicating the issue, gentrification frequently occurs along racial and economic fault lines.
For example, Seattle, like most U.S. metro areas, has a terrible history of systematic racial discrimination through the process of redlining. Redlining is "the practice by banks and other lending institutions of refusing home loans or requiring higher interest rates and larger down payments to otherwise credit worthy people because they happen to live in a certain area." Central Seattle Community Council Federation, Redlining and Disinvestment in Central Seattle: How the Banks are Destroying our Neighborhoods (July 1975) Link to Report. For more information about redlining in Seattle, see the CityArchives site.
As a result, decades of redlining forced African-Americans to live in Seattle's Central Area while it suffered from disinvestment and low property values. Then, Seattle's hot housing market pushed wealthier people into the Central Area. This increased demand for housing and the associated property renovation by the new residents, increased property values and the corresponding costs of insurance and property taxes. This increased cost of living caused longtime residents and businesses to move, often out of economic necessity, and thereby changed the character and culture of the Central Area.
As the Central Area example demonstrates, gentrification tends to increase the burden on members of society who are already disadvantaged. Of course, gentrification is just one process that contributes to inequality. But, if we could measure gentrification, we could devise systemic policy interventions for improving society.
However, there is no consensus about how to define gentrification.
The best way to measure this process would be to ask the emigrating and immigrating residents: (1) why they moved out of the neighborhood and (2) why they moved into the neighborhood. But, we couldn't find anyone who collects that data. So we ask the question, how should we measure gentrification?
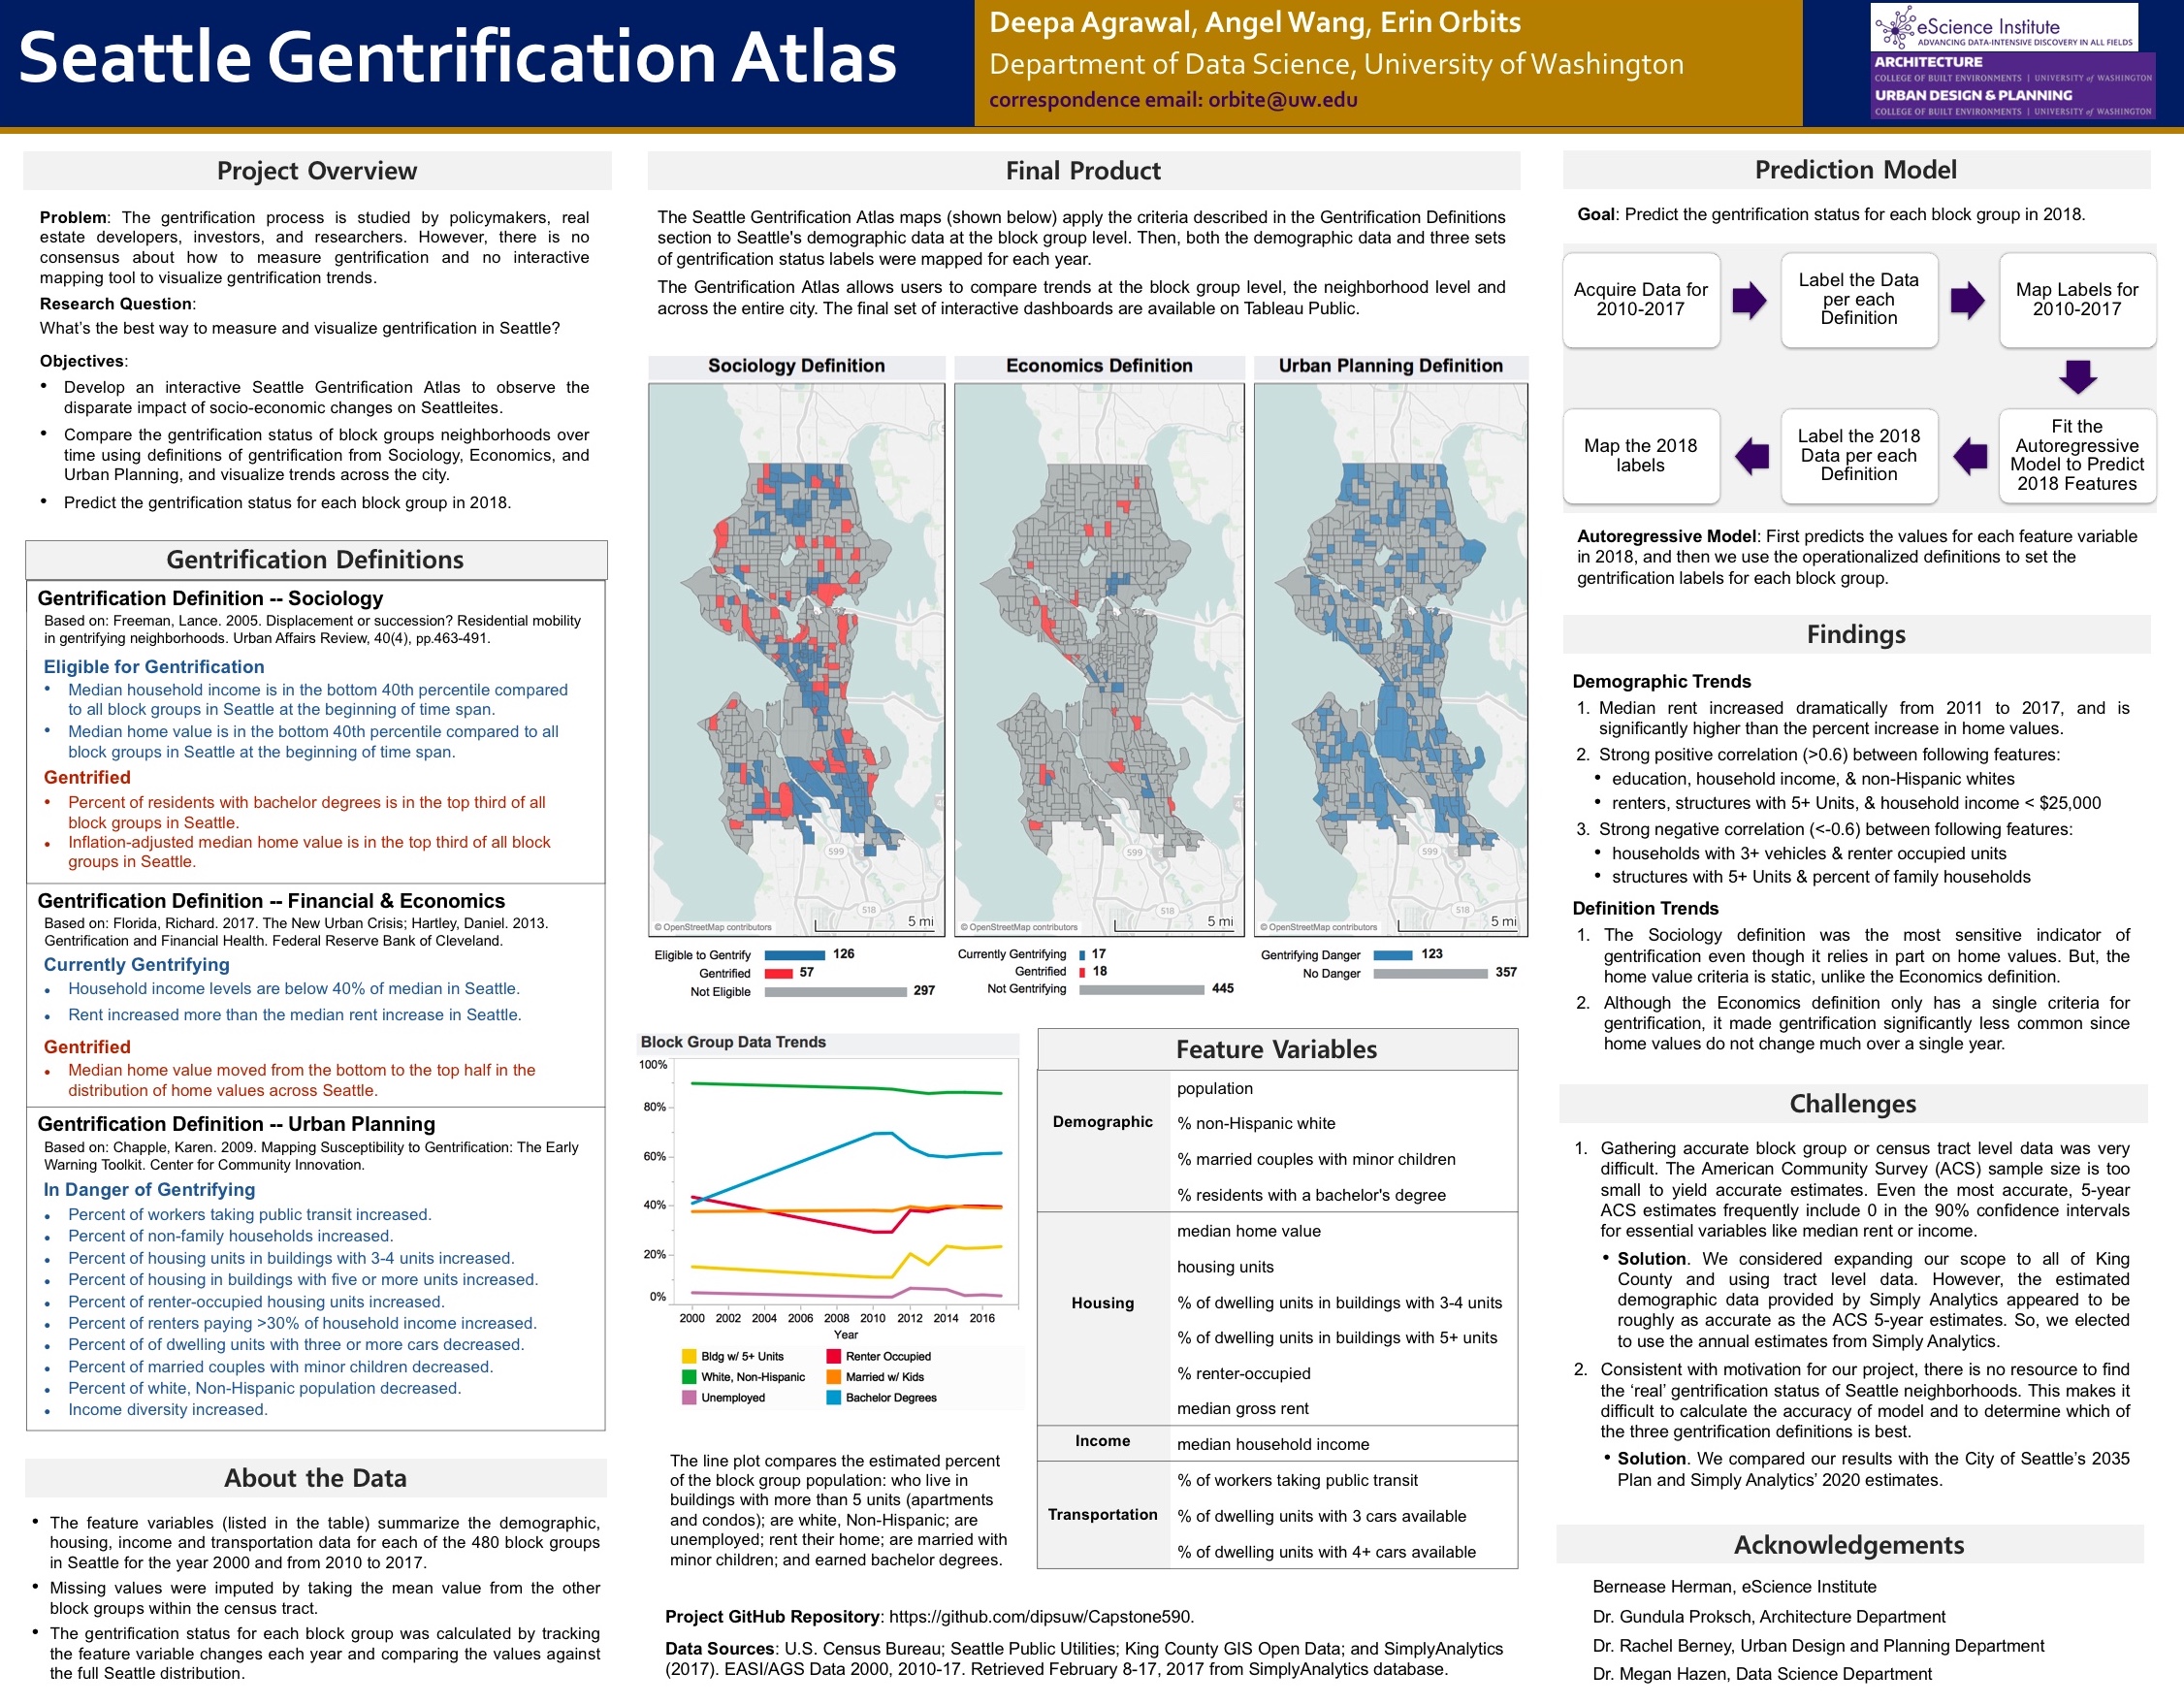
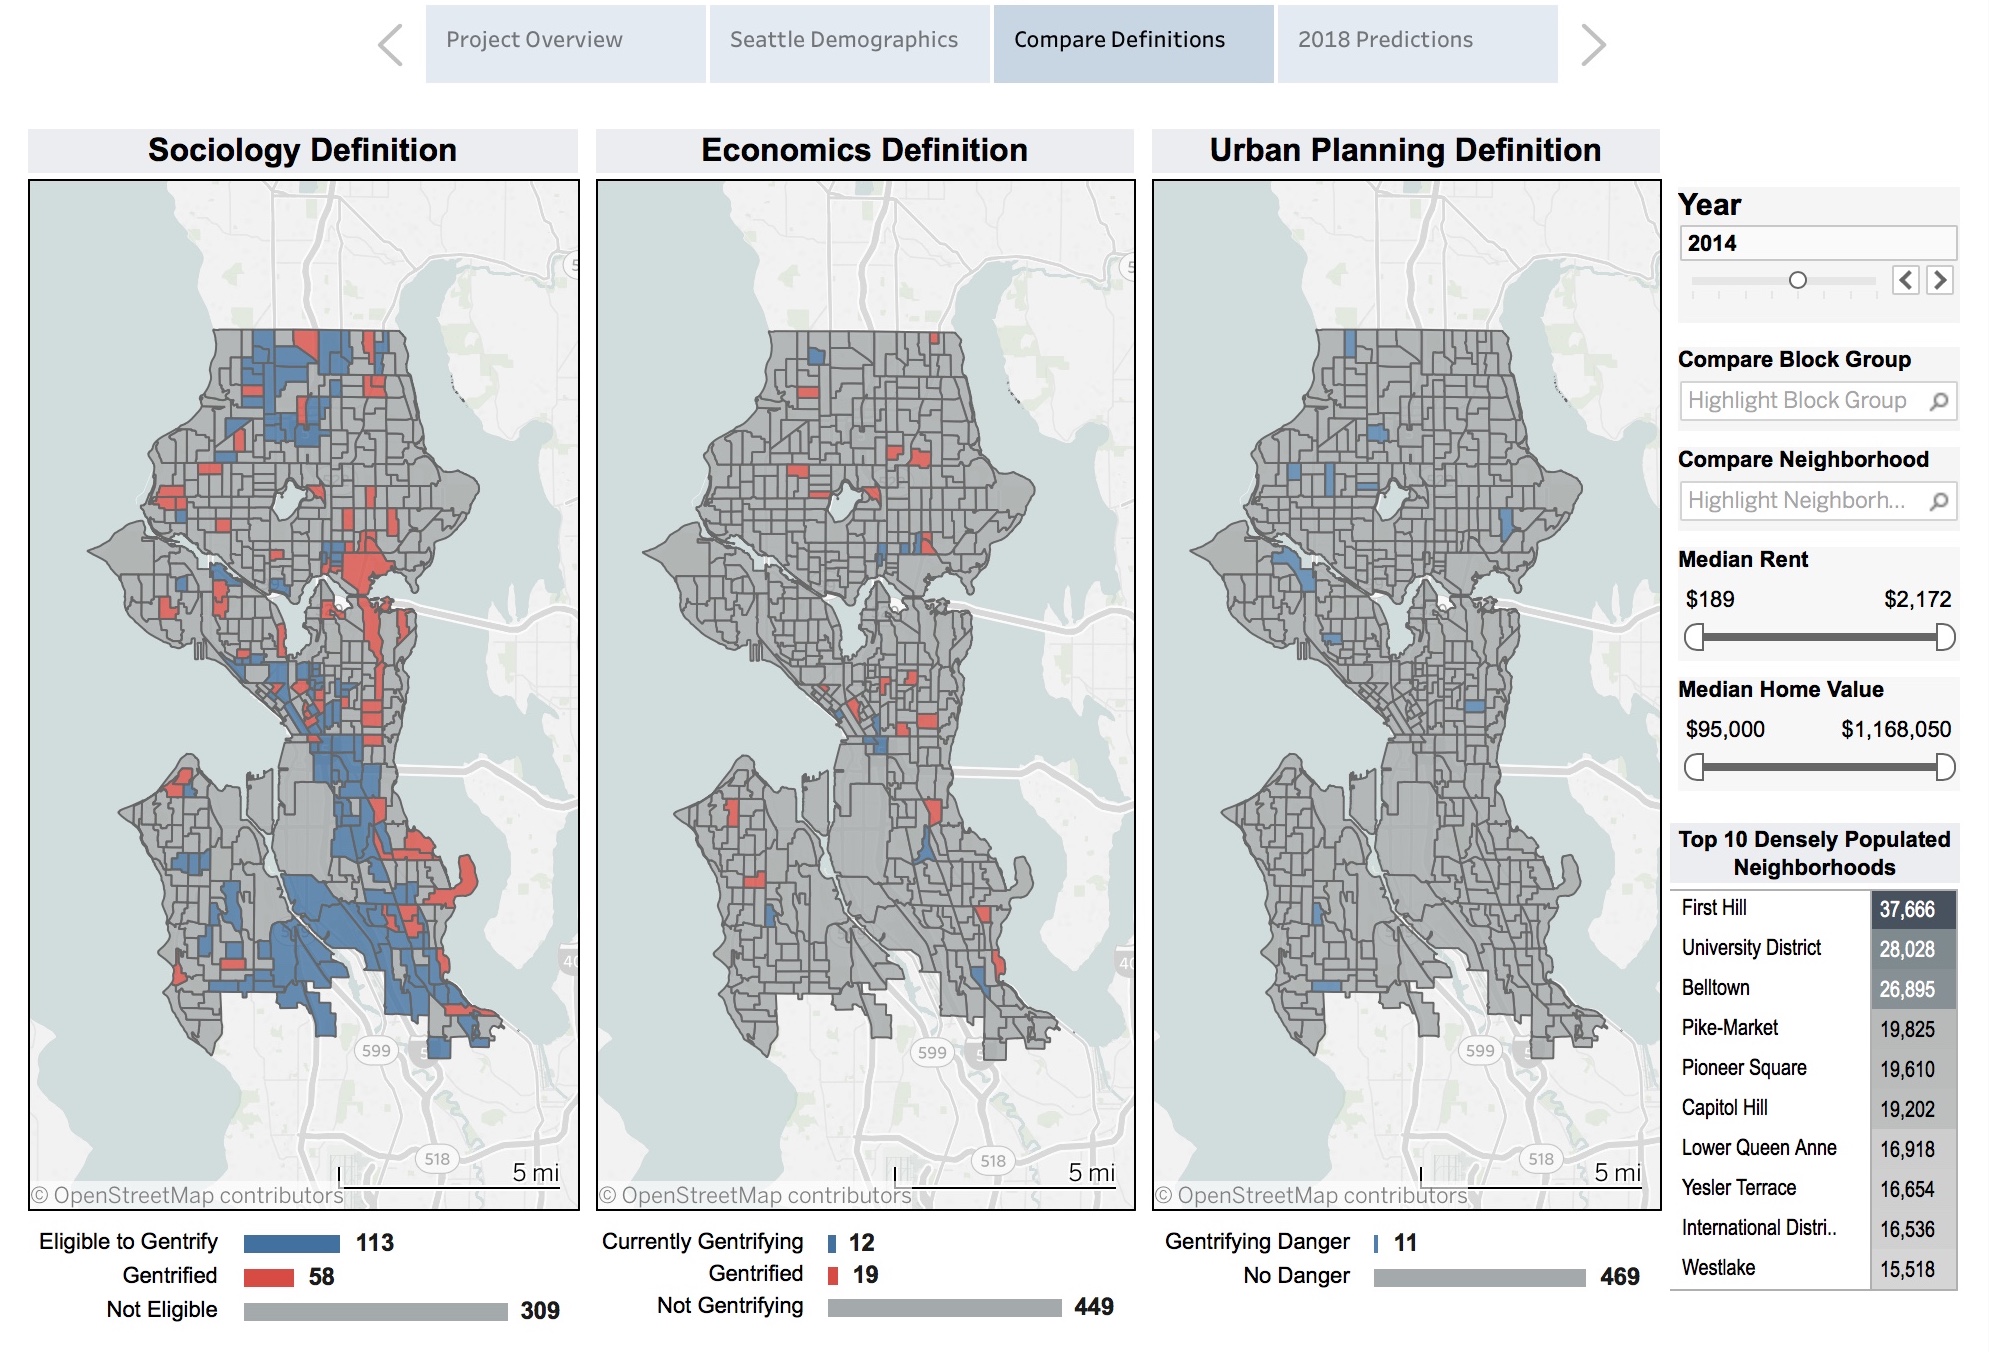
In an attempt to answer this question, we compared gentrification definitions from the fields of Sociology, Economics, and Urban Planning. Applying these definitions to estimates based on census data, the Atlas identifies census block groups: that have gentrified, that are currently gentrifying, and that are in greatest danger of gentrifying.
The Atlas combines data analysis with GIS-based visualizations to produce spatial maps to reflect how gentrification has changed Seattle since 2000. We hope that visualizing patterns of gentrification provides increased insight into the disparate impact of socioeconomic changes among Seattle's neighborhoods.
- The demographic data was downloaded from the Simply Analytics database. Simply Analytics is only accessible through those academic institutions and public libraries which subscribe to the Simply Analytics database. SimplyAnalytics (2017). EASI/AGS Data 2000, 2010-17. Retrieved Feb. 8-17 2017, from SimplyAnalytics database.
- The demographic variable estimates we downloaded from Simply Analytics were calculated by Easy Analytic Software, Inc. (EASI). EASI is a New York-based independent developer of desktop and internet demographic data.
- The neighborhood shapefiles were supplied by the Seattle Public Utilities through the Seattle GIS Database.
- The census block group shapefiles were supplied by the U.S. Census Bureau.
- Other Useful Resources:
For information about how to label the data, see the notebook file: Label_SimplyAnalyticsData.ipynb.
- Jupyter Notebook is an open-source web application for viewing and distributing code. To download the Jupyter Notebook application, see Installation, and for more information, see Documentation.
- You will need Python 3.X and the following Python libraries to run the code in
Label_SimplyAnalyticsData.ipynb.- json : is used in
get_data_census_api.ipynb - Matplotlib : is used for data visualization
- Numpy : is used for data calculations
- Pandas : is used for data processing
- json : is used in
- Median rent increased dramatically from 2011 to 2017, and is significantly higher than the percent increase in home values.
- Strong positive correlation (>0.6) between following features:
- education, household income, & non-Hispanic whites
- renters, structures with 5+ Units, & household income < $25,000
- Strong negative correlation (<-0.6) between following features:
- households with 3+ vehicles & renter occupied units
- structures with 5+ Units & percent of family households
- The Sociology definition was the most sensitive indicator of gentrification even though it relies in part on home values. But, the home value criteria is static, unlike the Economics definition.
- Although the Economics definition only has a single criteria for gentrification, it made gentrification significantly less common since home values do not change much over a single year.
Karen Chapple's work in the San Francisco/Oakland area demonstrates a correlation between proximity to public transportation and gentrification. It would be interesting to compare the demographics of the block groups near the new light rail stations in Seattle to those block groups not within walking distance of any stations.
We have some business data in the Data folder, seattle_businesses.csv, it would be interesting to look at the rates of new businesses and what kinds of new businesses tend to move into block groups which are in danger of gentrification.
It would also be interesting to look at the crime rates in block groups which are in danger of gentrification. Crime data is available on the data.seattle.gov site.
- Zuk, M., & Chapple, K. (2015). Urban Displacement Project.
- Ken Steif, Alan Mallach, Michael Fichman, Simon Kassel. Predicting gentrification using longitudinal census data Urban Spatial Analysis
- Equitable Futures GitHub repository for the Equity Modeler prototype
The content of this project is licensed under the Creative Commons Attribution 3.0 license and the code used in this project is licensed under the MIT license.